Content Group 7 of Tajikistan
Sovereign Credit Ratings
Rating (Outlook) | Rating Date | |
| Moody's | B3 (Negative) | 10/12/2018 |
| Standard & Poor's | B- (Stable) | 28/08/2017 |
| Fitch Ratings | Not Rated | Not Rated |
Sources: Moody's, Standard & Poor's, Fitch Ratings
Competitiveness and Efficiency Indicators
World Ranking | |||
2018 | 2019 | 2020 | |
| Ease of Doing Business Index | 123/190 | 126/190 | 106/190 |
| Ease of Paying Taxes Index | 132/190 | 136/190 | 139/190 |
| Logistics Performance Index | 134/160 | N/A | N/A |
| Corruption Perception Index | 152/180 | 153/180 | N/A |
| IMD World Competitiveness | N/A | N/A | N/A |
Sources: World Bank, IMD, Transparency International
Fitch Solutions Risk Indices
World Ranking | |||
2018 | 2019 | 2020 | |
| Economic Risk Index Rank | 188/202 | 184/201 | 188/201 |
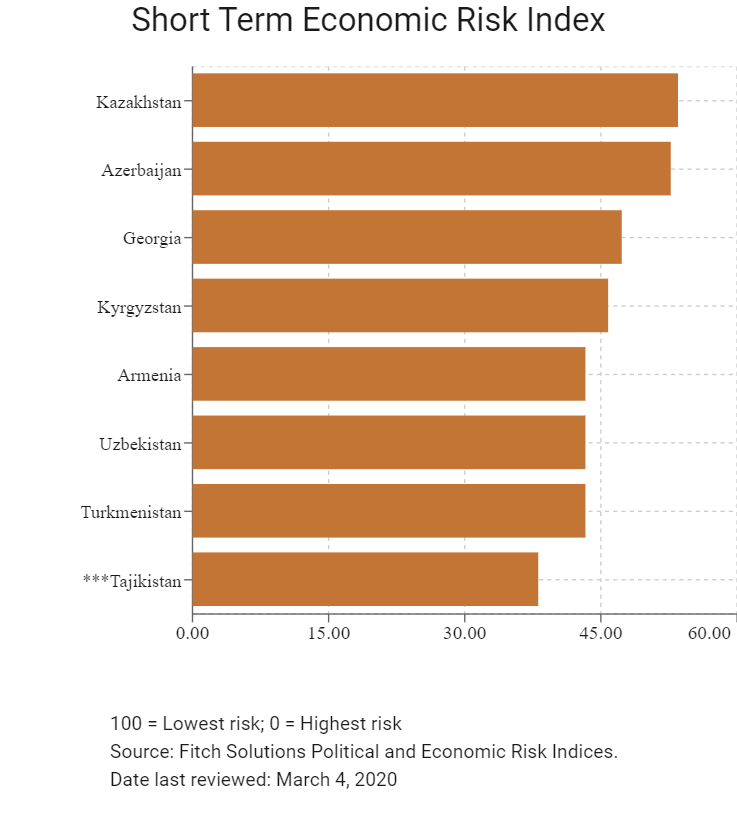
| Short-Term Economic Risk Score | 40.2 | 42.3 | 38.1 |
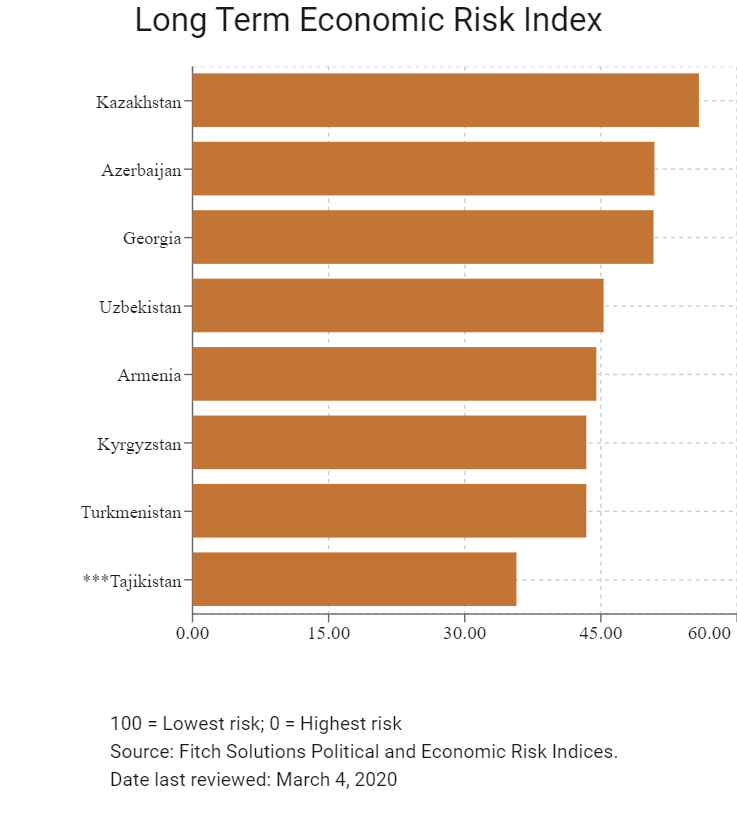
| Long-Term Economic Risk Score | 36.3 | 36.0 | 35.7 |
| Political Risk Index Rank | 189/202 | 184/201 | 183/201 |
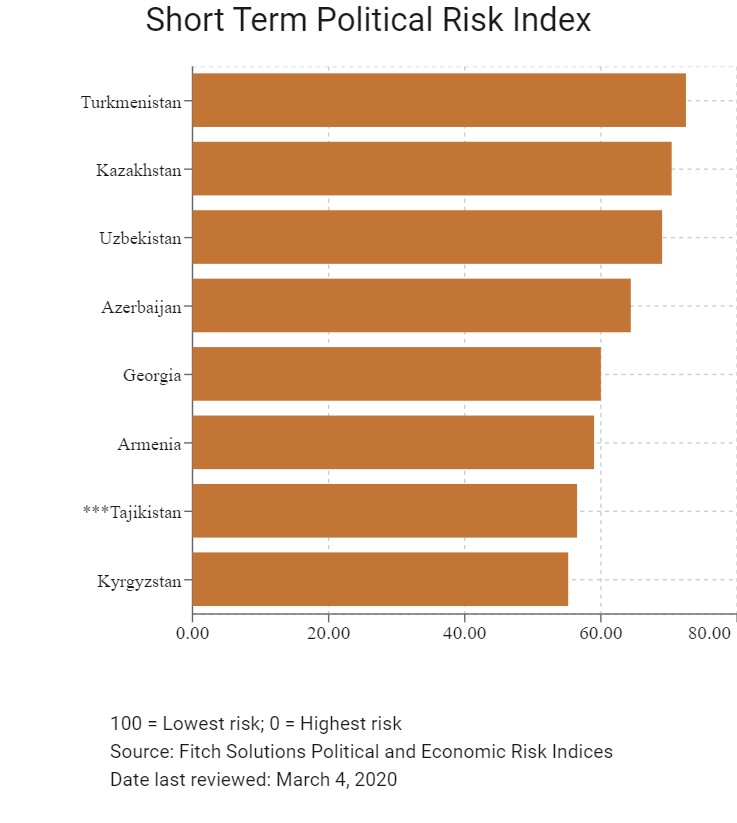
| Short-Term Political Risk Score | 49 | 49.0 | 56.5 |
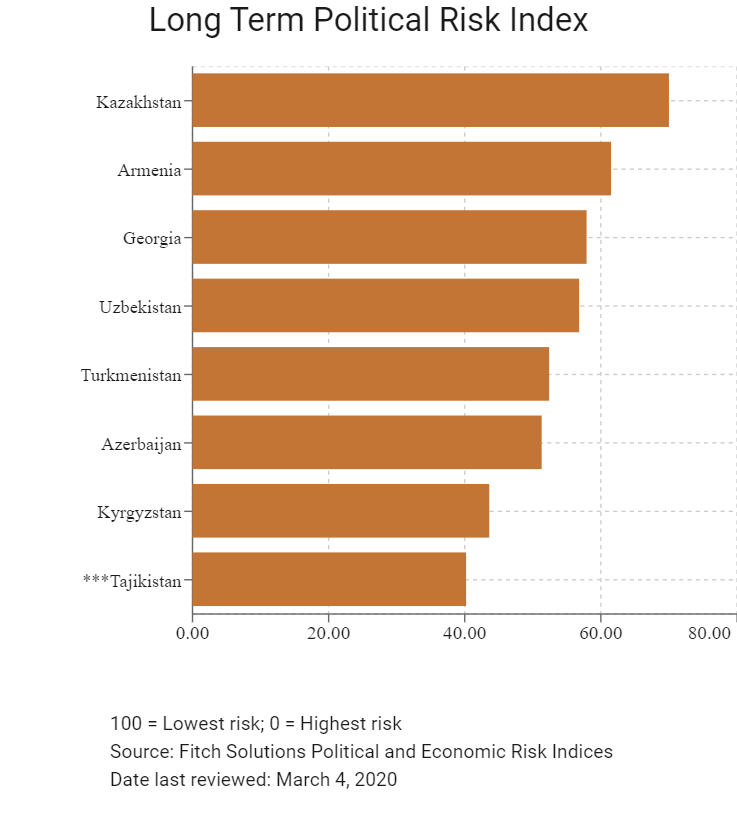
| Long-Term Political Risk Score | 36.2 | 40.2 | 40.2 |
| Operational Risk Index Rank | 126/201 | 124/201 | 124/201 |
| Operational Risk Score | 43 | 43.7 | 44.6 |
Source: Fitch Solutions
Date last reviewed: March 4, 2020
Fitch Solutions Risk Summary
ECONOMIC RISK
Tajikistan is one of the risk-exposed countries in the Central Asian region, as it remains excessively dependent on remittances from Russia. Tajikistan's economic success hinges on an agreement with the International Monetary Fund and the construction of the Rogun dam, which is projected to be completed in 2032. The government issued USD500 million of 10-year Eurobonds to finance the construction. If completed in time, the dam will produce enough electricity to meet Tajikistan's needs and to be sold to neighbouring countries. This would be a boost to the economy, which suffers from recurrent power outages. However, failure to complete the project risks complicating the process of restructuring its debt.
OPERATIONAL RISK
Businesses evaluating opportunities in Tajikistan will face a poor operating environment. The country's weakest points are its logistical profile and security environment, as ageing utilities and transport infrastructure mean power outages and road accidents are commonplace. The country's trade and investment, and labour environments do not perform much better, with factors such as a heavy economic reliance on remittances from Russia, high public debt and significant levels of bureaucratic red tape making it difficult to do business. Education levels are also poor in Tajikistan, with most workers in the formal economy being employed within the agricultural sector.
Date last reviewed: March 4, 2020
Fitch Solutions Political and Economic Risk Indicies
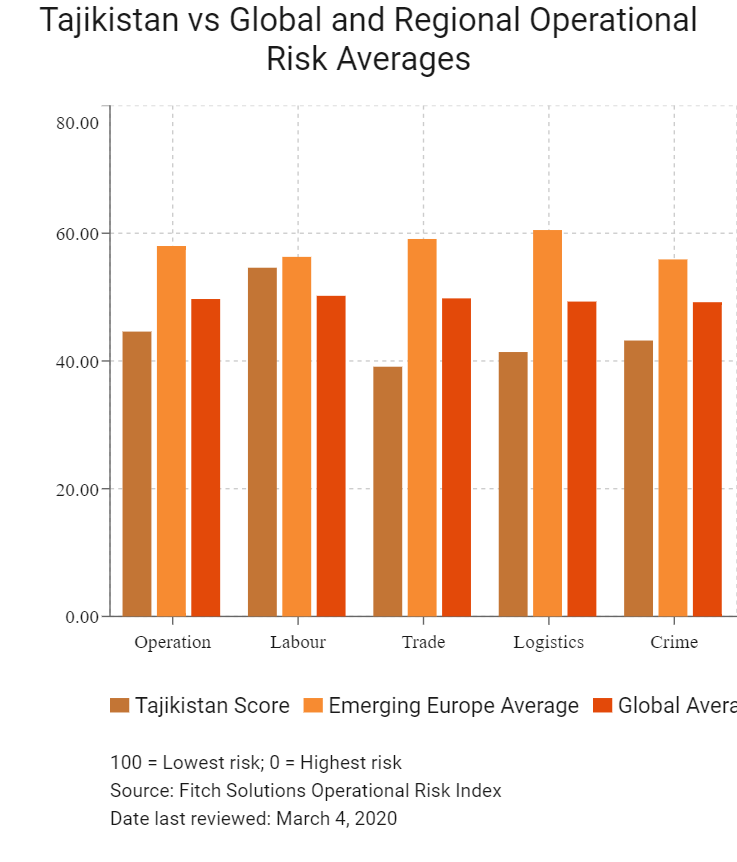
Fitch Solutions Operational Risk Index
Operational Risk | Labour Market Risk | Trade and Investment Risk | Logistics Risk | Crime and Security Risk | |
| Tajikistan Score | 44.6 | 54.6 | 39.1 | 41.4 | 43.2 |
| Caucasus and Central Asia Average | 51.8 | 58.2 | 53.4 | 50.5 | 44.9 |
| Caucasus and Central Asia Position (out of 8) | 7 | 6 | 8 | 7 | 5 |
| Emerging Europe Average | 58.0 | 56.3 | 59.1 | 60.5 | 55.9 |
| Emerging Europe Position (out of 31) | 30 | 21 | 31 | 30 | 25 |
| Global Average | 49.7 | 50.2 | 49.8 | 49.3 | 49.2 |
| Global Position (out of 201) | 124 | 71 | 139 | 120 | 120 |
100 = Lowest risk; 0 = Highest risk
Source: Fitch Solutions Operational Risk Index
Country/Region | Operational Risk Index | Labour Market Risk Index | Trade and Investment Risk Index | Logistics Risk Index | Crime and Security Risk Index |
| Georgia | 62.3 | 63.5 | 71.4 | 56.1 | 58.3 |
| Azerbaijan | 61.2 | 62.5 | 62.5 | 66.4 | 53.2 |
| Kazakhstan | 60.2 | 73.5 | 58.9 | 57.0 | 51.5 |
| Armenia | 56.8 | 60.5 | 58.6 | 53.9 | 54.2 |
| Kyrgyzstan | 44.9 | 54.1 | 44.6 | 43.1 | 37.7 |
| Uzbekistan | 44.7 | 54.8 | 53.1 | 39.2 | 31.7 |
| Tajikistan | 44.6 | 54.6 | 39.1 | 41.4 | 43.2 |
| Turkmenistan | 39.6 | 42.4 | 39.3 | 47.3 | 29.4 |
| Regional Averages | 51.8 | 58.2 | 53.4 | 50.5 | 44.9 |
| Emerging Markets Averages | 46.2 | 48.2 | 46.5 | 45.0 | 44.9 |
| Global Markets Averages | 49.7 | 50.2 | 49.8 | 49.3 | 49.2 |
100 = Lowest risk; 0 = Highest risk
Source: Fitch Solutions Operational Risk Index
Date last reviewed: March 4, 2020