Content Group 7 of Iran
Sovereign Credit Ratings
Rating (Outlook) | Rating Date | |
| Moody's | Withdrawn | Withdrawn |
| Standard & Poor's | Not rated | Not rated |
| Fitch Ratings | Not rated | Not rated |
Sources: Moody's, Standard & Poor's, Fitch Ratings
Competitiveness and Efficiency Indicators
World Ranking | |||
2018 | 2019 | 2020 | |
| Ease of Doing Business Index | 124/190 | 128/190 | 127/190 |
| Ease of Paying Taxes Index | 150/190 | 149/190 | 144/190 |
| Logistics Performance Index | 64/160 | N/A | N/A |
| Corruption Perception Index | 138/180 | 146/180 | N/A |
| IMD World Competitiveness | N/A | N/A | N/A |
Sources: World Bank, Transparency International, Fitch Solutions
Fitch Solutions Risk Indices
World Ranking | |||
2018 | 2019 | 2020 | |
| Economic Risk Index Rank | 127/202 | 137/201 | 130/201 |
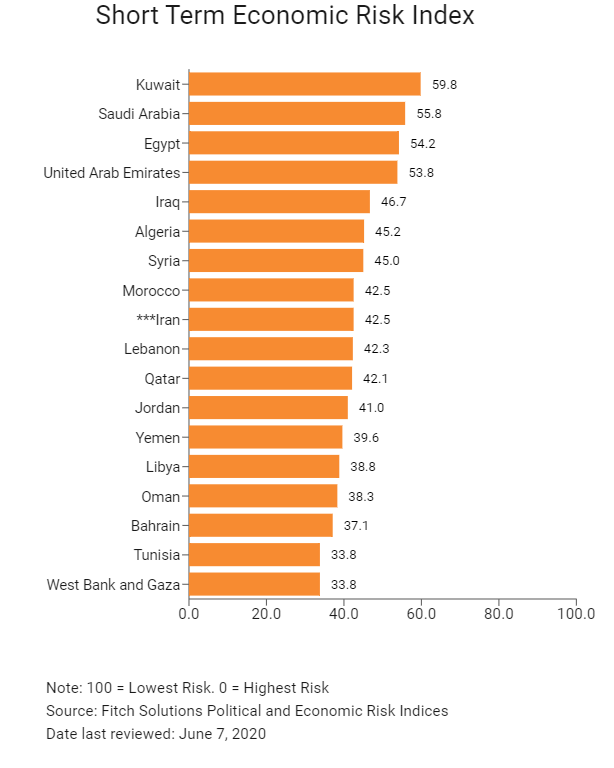
| Short-Term Economic Risk Score | 46 | 39.4 | 42.5 |
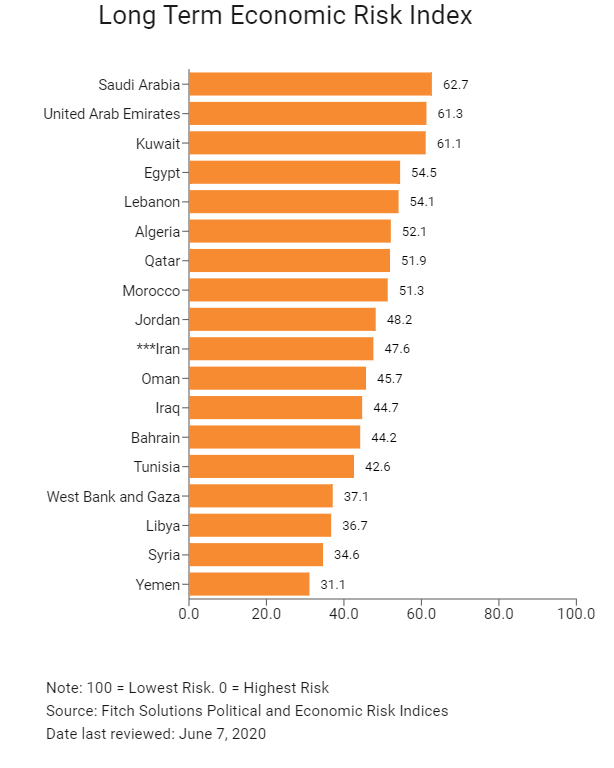
| Long-Term Economic Risk Score | 47.2 | 46.3 | 47.6 |
| Political Risk Index Rank | 138/202 | 139/201 | 140/201 |
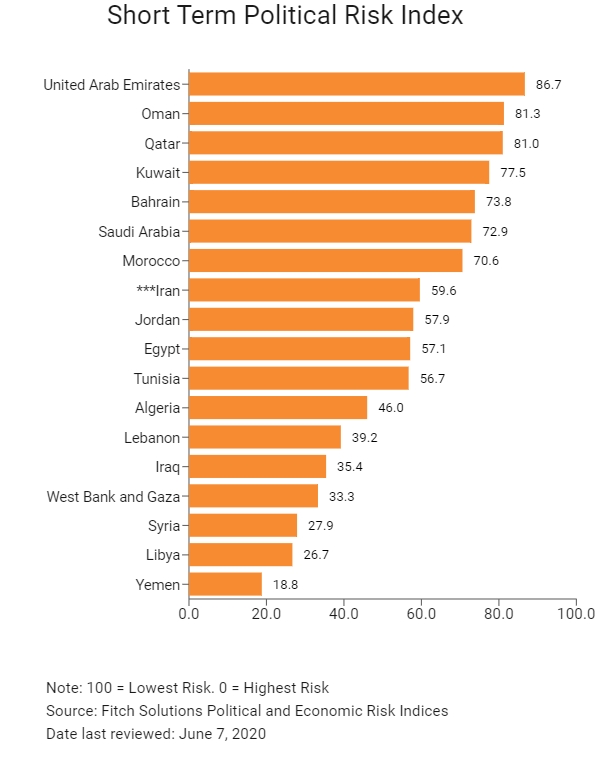
| Short-Term Political Risk Score | 62.1 | 59.6 | 59.6 |
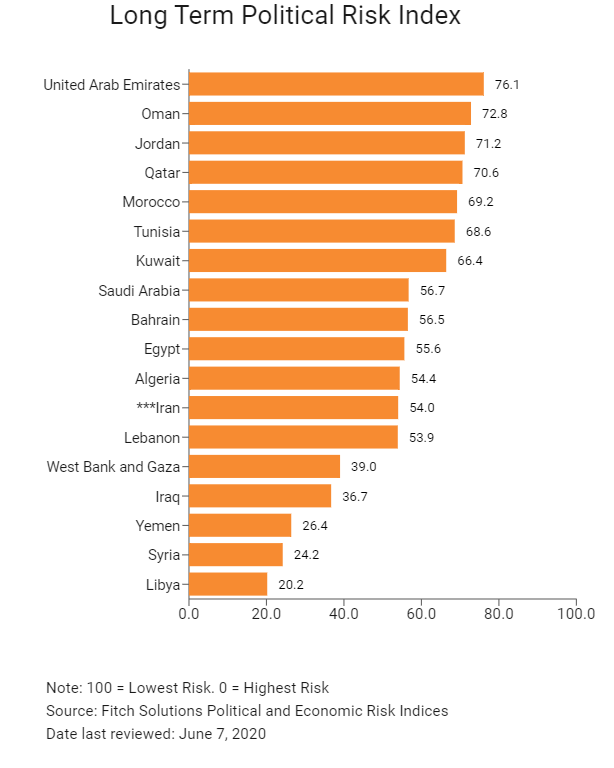
| Long-Term Political Risk Score | 54.0 | 54.0 | 54.0 |
| Operational Risk Index Rank | 122/201 | 126/201 | 127/201 |
| Operational Risk Score | 43.2 | 43.3 | 43.2 |
Source: Fitch Solutions
Date last reviewed: June 7, 2020
Fitch Solutions Risk Summary
ECONOMIC RISK
In 2020 the economy will contract for the third consecutive year. United States sanctions on the manufacturing sector will weigh on the non-oil private sector, while the oil economy remains crippled by prior sanctions and depressed energy prices. Moreover, the Covid-19 outbreak will further constrict activity. The risk of escalation of United States sanctions will impact the country's oil exports and investment inflows in the quarters ahead. Local currency depreciation and rising inflation are weighing on investment and consumption in real terms. Nevertheless, with some trade with Asia and Russia still likely to be maintained. In addition, Iran's long-term economic outlook could be one of the most promising in the Middle East and North Africa region, particularly in the event that the country can secure sanction relief, against the backdrop of a positive consumer story and efforts to comply with structural reforms to the economy and security sector. In the interim domestic political risk, elevated inflation and geopolitical tensions pose downside risks to the country’s near term outlook.
OPERATIONAL RISK
Iran's operating environment is facing considerable setbacks resulting from the decision of United States President Donald Trump to reintroduce broad sanctions and withdraw from the nuclear agreement reached in July 2015. While the other signatories to the agreement (the EU, Russia and Mainland China) have tentatively agreed to continue upholding it, most improvements to Iran's economy and business environment over the last three years are likely to be negatively affected by these recent developments. Doing business in the country will become more difficult once again, particularly for Western firms, while structural risks – including obstacles to trade, regulatory restrictions, onerous taxes and stringent labour laws – are likely to remain in place amid slow reform momentum.
Source: Fitch Solutions
Date last reviewed: June 9, 2020
Fitch Solutions Political and Economic Risk Indices
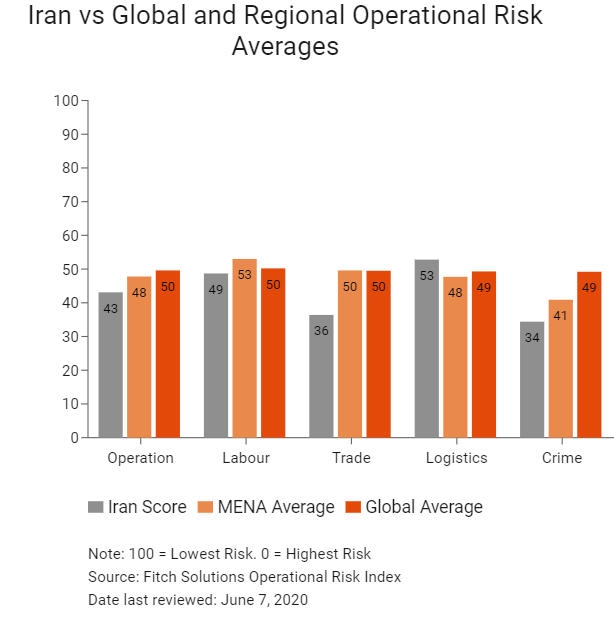
Fitch Solutions Operational Risk Index
Operational Risk | Labour Market Risk | Trade and Investment Risk | Logistics Risk | Crime and Security Risk | |
| Iran Score | 43.1 | 48.7 | 36.4 | 52.8 | 34.4 |
| MENA Average | 47.8 | 53.0 | 49.6 | 47.7 | 40.9 |
| MENA Position (out of 18) | 12 | 10 | 12 | 9 | 12 |
| Global Average | 49.6 | 50.2 | 49.5 | 49.3 | 49.2 |
| Global Position (out of 201) | 127 | 109 | 147 | 83 | 150 |
100 = Lowest risk, 0 = Highest risk
Source: Fitch Solutions Operational Risk Index
Country | Operational Risk Index | Labour Market Risk Index | Trade and Investment Risk Index | Logistics Risk Index | Crime and Security Risk Index |
UAE | 71.6 | 70.6 | 77.5 | 68.0 | 70.5 |
Bahrain | 66.5 | 65.5 | 75.4 | 71.6 | 53.6 |
Qatar | 66.0 | 66.7 | 62.3 | 73.7 | 61.2 |
Oman | 64.9 | 62.7 | 63.4 | 64.2 | 69.2 |
Saudi Arabia | 63.6 | 68.3 | 65.8 | 62.5 | 57.7 |
Jordan | 57.1 | 58.4 | 62.9 | 54.8 | 52.3 |
Kuwait | 55.5 | 58.7 | 56.2 | 50.8 | 56.2 |
Morocco | 54.6 | 45.0 | 65.3 | 54.9 | 53.2 |
Egypt | 49.4 | 50.7 | 48.8 | 55.2 | 42.9 |
Tunisia | 47.1 | 41.0 | 58.5 | 46.7 | 42.3 |
Lebanon | 43.6 | 54.0 | 49.8 | 40.9 | 29.7 |
Iran | 43.1 | 48.7 | 36.4 | 52.8 | 34.4 |
Algeria | 39.6 | 48.6 | 32.7 | 41.0 | 36.2 |
West Bank and Gaza | 31.6 | 48.3 | 34.1 | 27.1 | 17.0 |
Libya | 29.3 | 43.4 | 29.9 | 26.6 | 17.1 |
Syria | 28.6 | 42.6 | 29.2 | 27.6 | 15.0 |
Iraq | 26.7 | 43.5 | 24.1 | 26.9 | 12.4 |
Yemen | 21.8 | 37.8 | 19.6 | 13.9 | 16.1 |
Regional Averages | 47.8 | 53.0 | 49.6 | 47.7 | 40.9 |
Emerging Markets Averages | 46.9 | 48.5 | 47.2 | 45.8 | 46.0 |
Global Markets Averages | 49.6 | 50.2 | 49.5 | 49.3 | 49.2 |
100 = Lowest risk, 0 = Highest risk
Source: Fitch Solutions Operational Risk Index
Date last reviewed: June 7, 2020