 Mainland China

GDP (US$ Billion)
13,407.00 (2018)
World Ranking 2/194

GDP Per Capita (US$)
9,608 (2018)
World Ranking 72/193

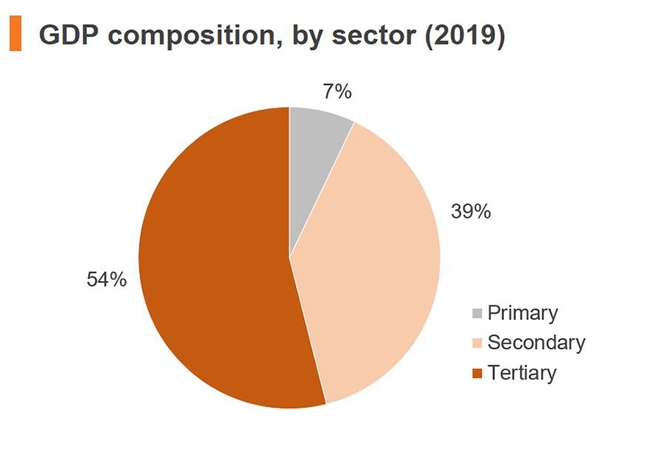
Economic Structure
(in terms of GDP composition, 2017)

External Trade (% of GDP)
37.8 (2017)

Currency (Period Average)
Renminbi
6.6174per US$ (2018)

Political System
Single-party people's republic
Sources: CIA World Factbook, Encyclopædia Britannica, IMF, Pew Research Center, United Nations, World Bank
Latest development
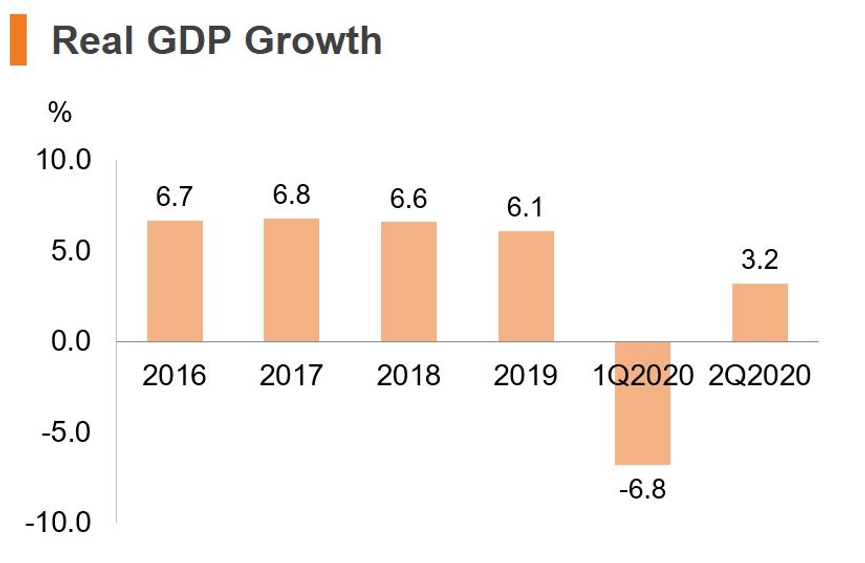
- China’s GDP declined by 6.8% in the first quarter of 2020 and grew by 3.2% in the second quarter of 2020.
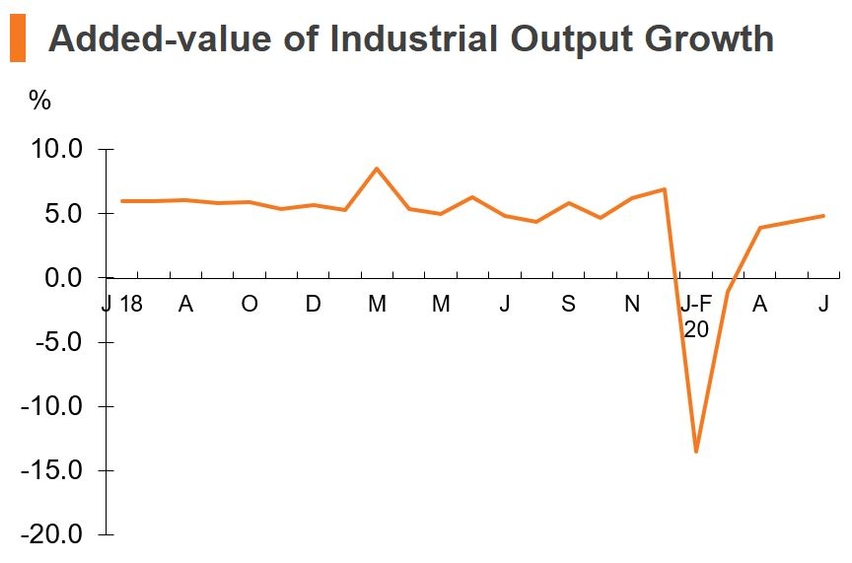
- Added-value industrial output grew by 4.8% in June 2020 up from 4.4% in May 2020.
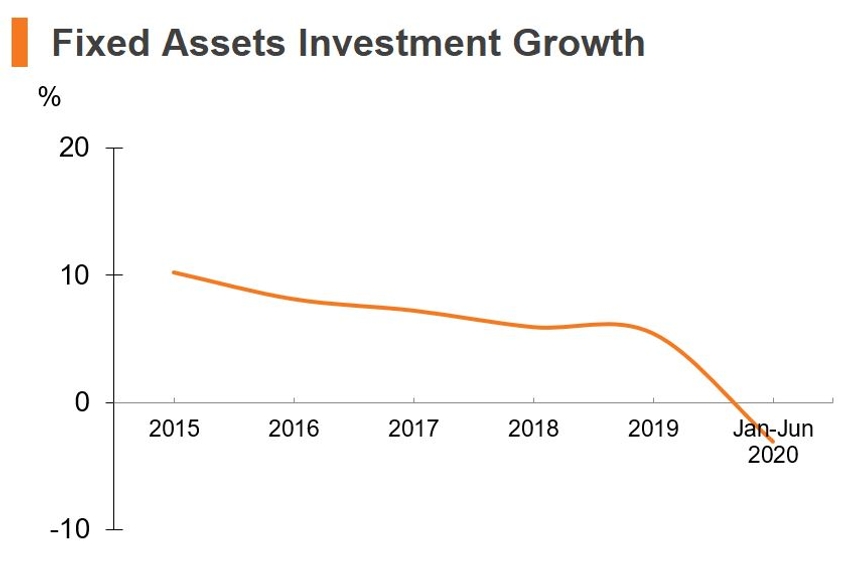
- Fixed assets investment declined by 3.1% in Jan-Jun 2020, which was narrowed by 3.2 percentage points compared with that in Jan-May 2020.
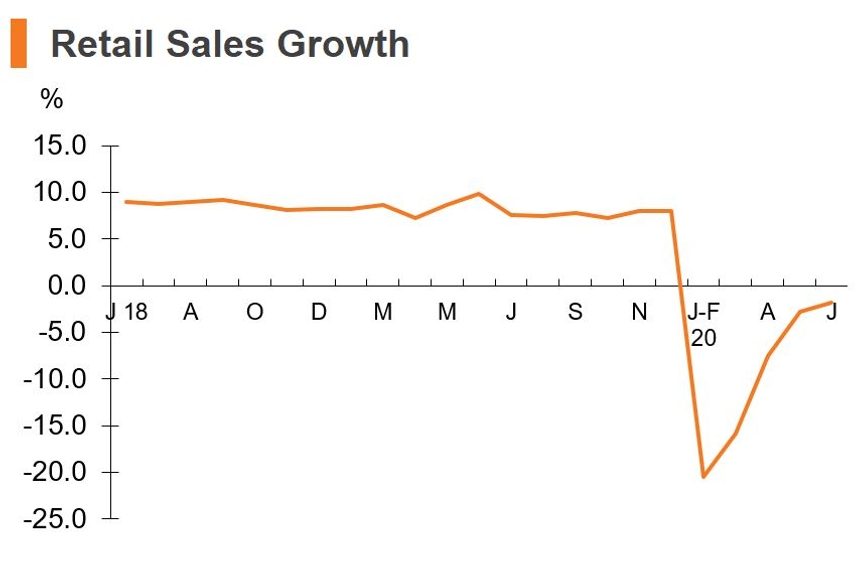
- Retail sales decreased by 1.8% in June 2020, registering a decline narrowed by 1.0 percentage points compared with May 2020.
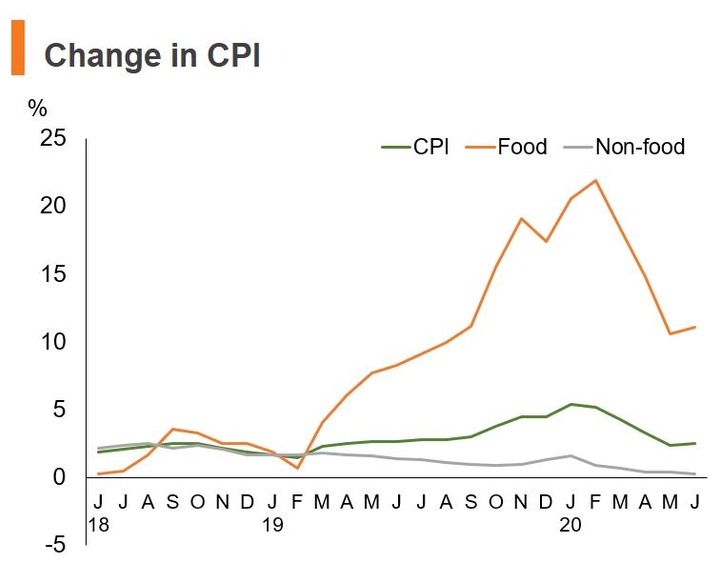
- Inflation stood at 2.5% in June 2020, with food prices increased by 11.1% and non-food prices increased by 0.3%.
- In June 2020, exports (in terms of US$) increased by 0.5%, while imports (in terms of US$) increased by 2.7%, resulting in a trade surplus of US$46.4 billion.
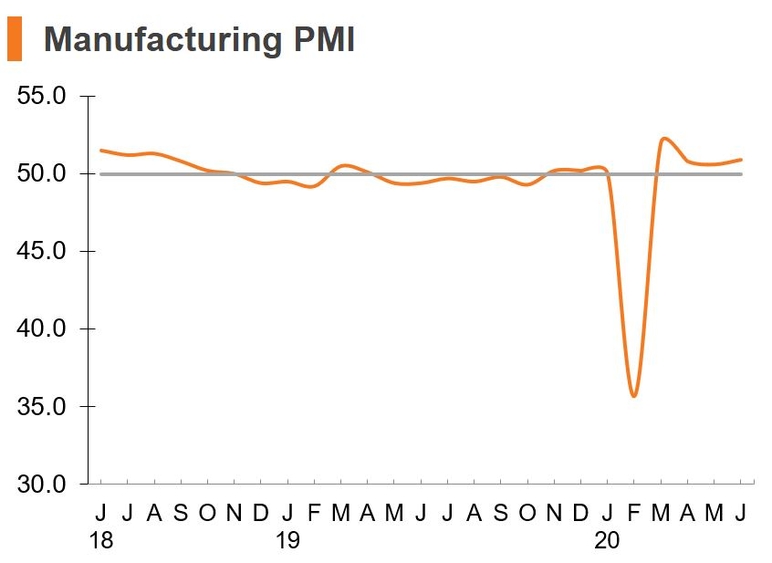
- The Manufacturing Purchasing Managers’ Index up from 50.6 in May 2020 to 50.9 in June 2020.
|
Major Economic Indicators |
2019 |
Jan-Jun 2020 |
||
|
Value |
Growth (%) |
Value |
Growth (%) |
|
|
Population (mn) |
1,400.0 |
- |
1,400.0 |
- |
|
Gross Domestic Product (RMB bn) |
99,086.5 |
6.11 |
45,661.4 |
-1.61 |
|
GDP Per Capita (RMB) |
70,892 |
5.7 |
- |
- |
|
Fixed Assets Investment 2 (RMB bn) |
55,147.8 |
5.4 |
28,160.3 |
-3.1 |
|
Added-Value of Industrial Output 3 |
- |
5.71 |
- |
-1.31 |
|
Consumer Goods Retail Sales (RMB bn) |
41,164.9 |
8.0 |
17,225.6 |
-11.4 |
|
Consumer Price Index |
- |
2.9 |
- |
3.8 |
|
Exports (US$ bn) |
2,498.4 |
0.5 |
1,098.8 |
-6.2 |
|
Imports (US$ bn) |
2,076.9 |
-2.8 |
931.0 |
-7.1 |
|
Trade Surplus (US$ bn) |
421.5 |
- |
167.8 |
- |
|
Utilised Foreign Direct Investment (US$ bn) |
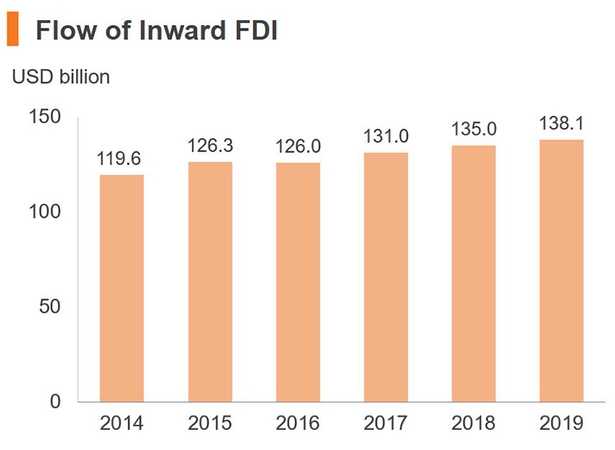
138.1 |
2.4 |
- |
- |
|
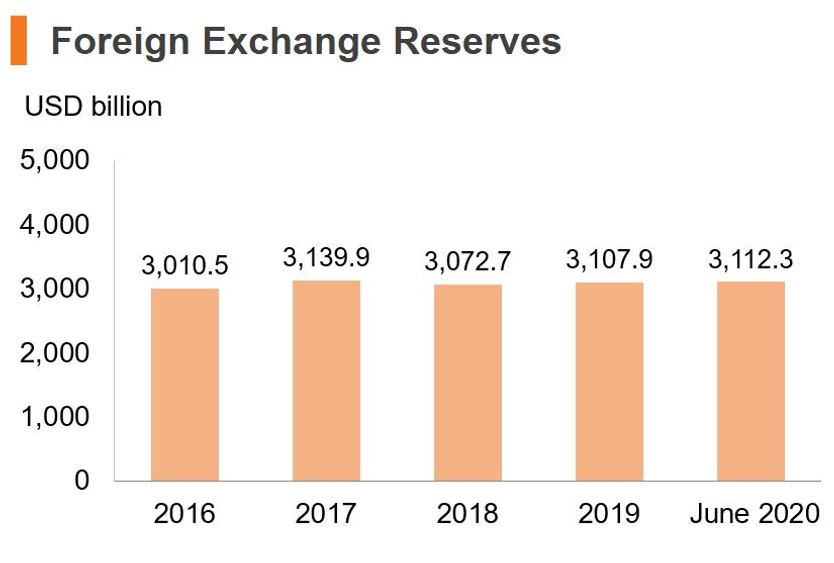
Foreign Currency Reserves (US$ bn) |
3,107.9 |
1.1 |
3,112.34 |
-0.2 |
|
Note: 1 Real growth Sources: The National Bureau of Statistics, Ministry of Commerce, and General Administration of Customs. |
||||
Major International Ranking
- According to the World Bank, China is the second-largest economy in the world, behind the United States, ahead of Japan.
- According to UNCTAD World Investment Report, China was the second-largest recipients of FDI inflows (USD 141 billion) in the world in 2019 (China ranked 2nd in 2008), behind the United States (USD 246 billion).
- According to UNCTAD World Investment Report, China was the fourth-largest source of outward FDI flows (USD 117 billion) in the world in 2019 (up from the 11th in 2008), behind Japan (USD 227 billion), the United States (USD 125 billion) and the Netherlands (USD 125 billion).
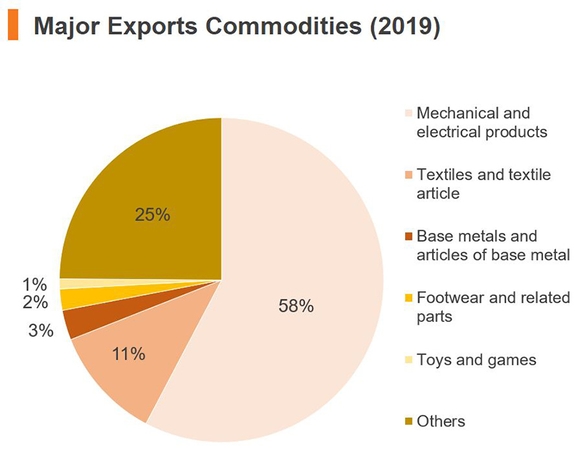
- According to the World Trade Organisation (WTO), China was the world’s largest exporter of merchandise trade in 2019 (up from the 11th in 1995), reaching USD 2,499 billion.
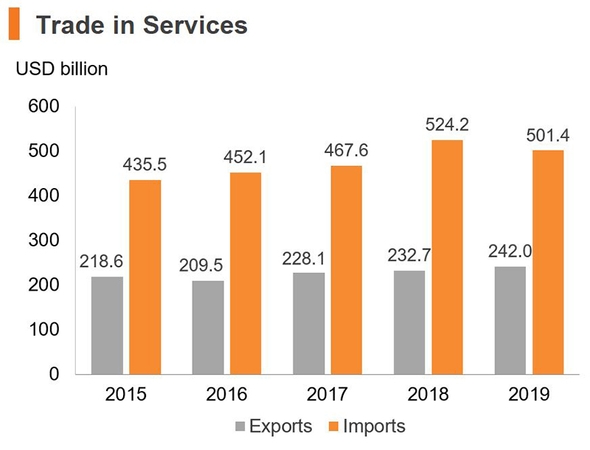
- According to WTO, China was the world’s 4th largest exporter of commercial services in 2019 (up from the 16th in 1995), reaching USD282 billion.
- According to International Monetary Fund, China has the largest foreign currency reserves as of December 2019, reaching USD 3,108 billion.
- According to HKSAR Marine Department, Shanghai’s container throughput surpassed Singapore and ranked the first in the world since 2010.
- According to World Tourism Organisation (UNWTO), China ranked the world’s top tourism spending in 2018 (USD 277 billion), followed by the United States (USD 144 billion) and Germany (USD 94 billion).
- According to Hong Kong Securities and Futures Commission, as at end December 2019, the market capitalisation of Shanghai Stock Exchange is the second-largest in Asia (after Japan) and the fourth largest in the world.
Recent Government Initiatives
- In March 2016, the National People’s Congress (NPC) adopted the 13th Five-Year Plan. It also announces the launch of six key scientific and technological (S&T) projects and nine major projects under the “Scientific Innovation 2030” initiative, as well as the implementation of the “Made in China 2025” strategy for building a strong manufacturing country.
- The Belt and Road Initiative (BRI) is a significant development strategy launched by the Chinese government in March 2015. The Chinese government also issued its Vision and Actions of Jointly Building the Silk Road Economic Belt and 21st Century Maritime Silk Road which outlined the framework, key areas of cooperation and cooperation mechanisms regarding the BRI.
- The State Council promulgated the Outline Development Plan for the Guangdong-Hong Kong-Macao Greater Bay Area on 18 February 2019, mapping out the development plan for the Greater Bay Area (GBA). The Greater Bay Area is strategically positioned to be (i) a vibrant world-class city cluster; (ii) a globally influential international innovation and technology hub; (iii) an important support pillar for the Belt and Road Initiative; (iv) a showcase for in-depth cooperation between the Mainland and Hong Kong and Macao; and (v) a quality living circle for living, working and travelling.
- On 5 July 2019, Guangdong has issued two key strategy documents relating to the Greater Bay Area – the Implementation Plan for the Outline Development Plan for the Guangdong-Hong Kong-Macao Greater Bay Area and a Three-Year Action Plan for Building the Guangdong-Hong Kong-Macao Greater Bay Area (2018-2020). The Action Plan proposes the implementation of 100 key measures across nine areas, including optimising and upgrading the environment of the GBA’s four core cities, establishing an international science and technology innovation centre and maintaining a state-of-the-art infrastructure base.
- On 9 August 2019, China’s State Council has endorsed plans to establish Shenzhen as a model for the country’s wider urban development and, ultimately, one of the foremost cities in the world in terms of economic resource and sustained, high-quality development. The five priorities for its future development include: establishing a national model for high-quality development, delivering exemplary law-based governance, proving a model of optimum urban living, prioritising the prosperity and wellbeing of residents and pioneering sustainable development in an urban environment.
- During the Boao Forum in April 2018, President Xi Jinping announced that China decides to adopt a series of new significant measures in expanding its opening-up. These measures include broadening market access, enhancing alignment with international economic and trade rules, strengthening protection of intellectual property rights and lowering imports tariffs.
- China is shifting towards a consumption-driven economy by lowering its import tariffs. In November 2017, China cut import tariff on 187 consumer goods, the tariffs drop from an average 17.3% to 7.7% on products including pharmaceuticals, food, health supplements and clothing. From 1 July 2018, China has further reduced tariffs on 1,449 items, from an average tariff rate of 15.7% to 6.9%; and lower import tariffs on vehicles (from average 21.5% to 13.8%) and auto parts (from average 10.2% to 6.0%).
- China reduced the Most-Favoured-Nation (MFN) tariff on 1,585 taxable items as of 1 November 2018. This coincided with the provisional MFN tariff rates being abolished for 39 import items, while the existing MFN provisional tariff rates remained in force for all goods unaffected by this latest round of cut. In total, the tariff reductions apply to 19% of all taxable import items, with the average tariff rate having fallen from 10.5% to 7.8%.
- The provisional import and export tariffs on a range of goods were revised as of 1 January 2019 in line with a prior announcement by the State Council Customs Tariff Commission. This has seen new provisional tax rates applied to such items as food stuffs and various categories of industrial equipment, while duty on several information technology products will be removed and the rates for a raft of other IT products reduced as of 1 July 2019.
- From 1 April 2019, China implemented a value-added tax (VAT) cut for manufacturing sector from 16% to 13% and VAT cut for construction and transportation sectors from 10% to 9%. From 1 May 2019, China reduced social security fees from 20% to 16%.
- The Foreign Investment Law of the People’s Republic of China took effect from 1 January 2020. This law assures non-mainland investors of national level protection for all their committed funds, income and other interests, provided their projects so not fall within the remit of the statutory Negative list.
Major Economic Indicators
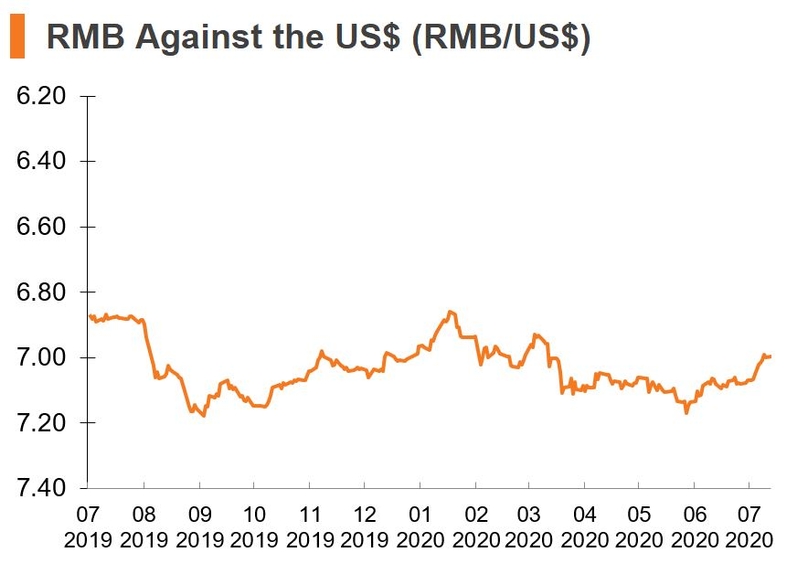
Sources: The National Bureau of Statistics, Pacific Exchange Rate Service; State Administration of Foreign Exchang
External Trade
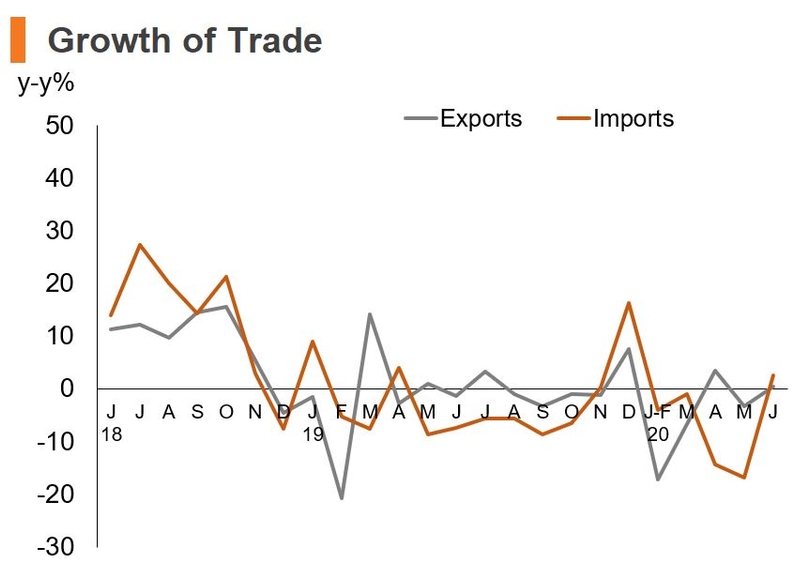
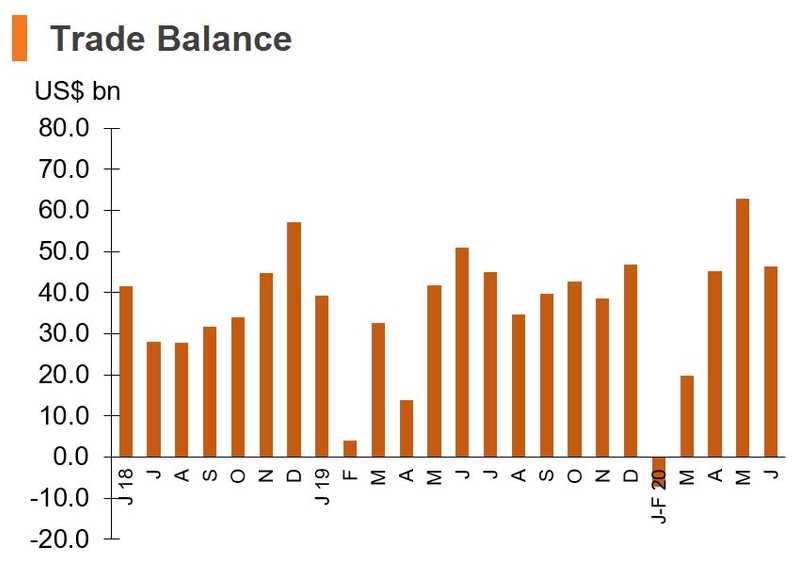
Sources: Ministry of Commerce, General Administration of Customs
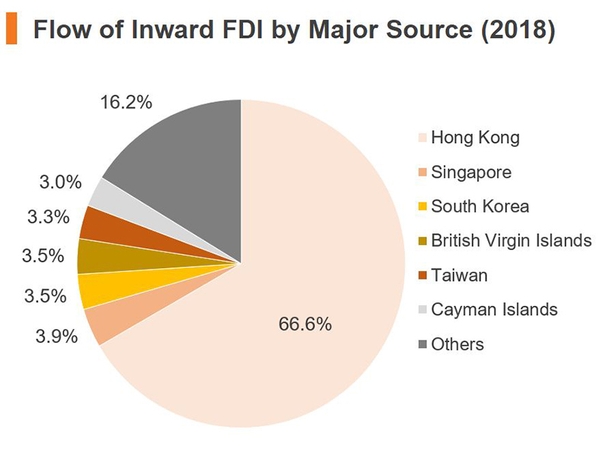
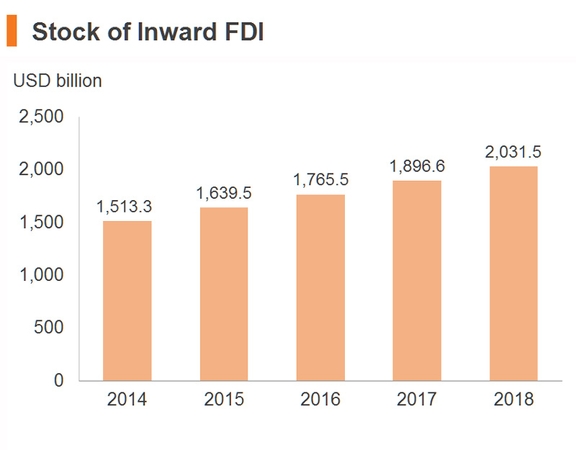
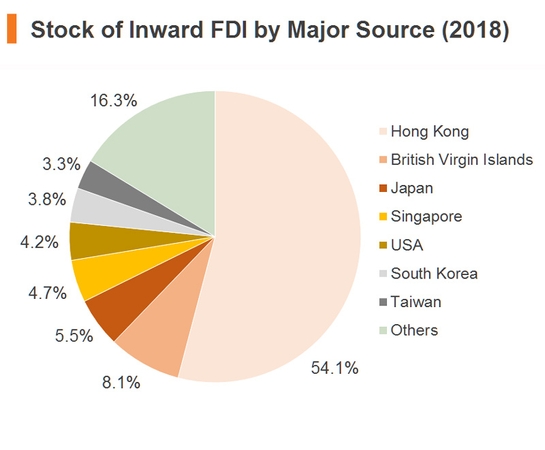
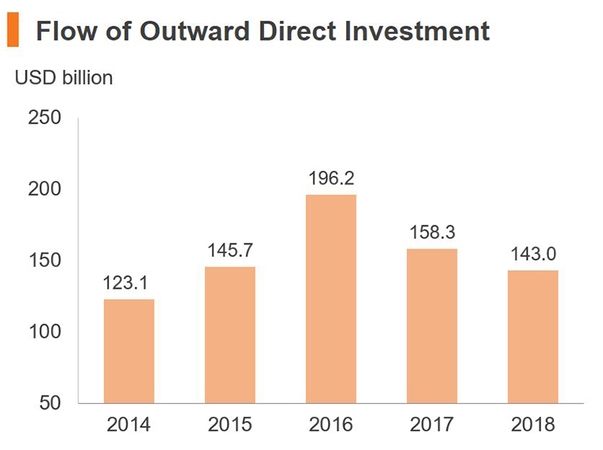
Investment Flows
Trade Relations, Trade Policies and Tax Treaties
Trade Relations
- Founding member of the Asian Infrastructure Investment Bank (AIIB)
- Member of the World Trade Organization (WTO)
- Member of the Asia-Pacific Economic Cooperation (APEC)
- Member of the Pacific Economic Cooperation Council (PECC)
- Member of the Asian Development Bank (ADB)
- Member of the United Nations Economic and Social Commission for Asia and the Pacific (ESCAP)
- Observer of the Trade Committee of the Organization for Economic Cooperation and Development (OECD)
Trade Policies
- According to WTO, China’s average applied most favoured nation (MFN) tariff rate was 9.8% in 2018, progressively down from 15.3% in 2001. The average tariff was higher for agricultural products at 15.6% while the average tariff for non-agricultural products was 8.8%.
- Since expanding domestic consumer demand is an important move in achieving stable economic growth and economic restructuring, the State Council further reduced the import tariffs on 187 foreign daily consumer goods items in December 2017. The average import tariff has been lowered down from 17.3% to 7.7%. On 1 July 2018, China will further lower import tariff on 1,449 items, from an average tariff rate of 15.7% to 6.9%.
- China adopted the practice of “quarantine inspection before customs declaration” in customs clearance. Import Goods Clearance Slips and Export Goods Clearance Slips stamped with the special seal of inspection and quarantine authorities are issued to goods subject to entry-exit inspection and quarantine. The Customs will examine and release the goods against the Import Goods Clearance Slip or Export Goods Clearance Slip issued by the entry-exit inspection and quarantine authorities at the place of customs declaration.
- Inspection is required for all import and export goods listed in the Catalogue of Import and Export Commodities Subject to Inspection and Quarantine by Entry-Exit Inspection and Quarantine Authorities, or subject to inspection pursuant to other laws and regulations.
- Safety licence and other regulatory requirements apply to imports of medicines, foodstuffs, animal and plant products, and mechanical and electronic products. For details, please refer to State Administration for Market Regulation website.
For details, please refer to Guide to Doing Business in China.
Free Trade Agreements (FTAs)
Currently, China has signed and implemented 20 free trade agreements (FTAs), 13 FTAs are under negotiation and another 8 FTAs are under considerations. China has also signed and implemented 1 preferential trade agreement.
China’s FTAs (signed and implemented)
- China-Mauritius FTA
- China-Maldives FTA
- China-Georgia FTA
- China-Australia FTA
- China-Korea FTA
- China-Switzerland FTA
- China-Iceland FTA
- China-Costa Rica FTA
- China-Peru FTA
- China-Singapore FTA
- China-New Zealand FTA
- China-Chile FTA
- China-Pakistan FTA
- China-ASEAN FTA
- Mainland and Hong Kong Closer Economic and Partnership Agreement (CEPA)
- Mainland and Macau Closer Economic and Partnership Agreement
- China-ASEAN FTA Upgrade
- China-Chile FTA Upgrade
- China-Singapore FTA Upgrade
- China-Pakistan FTA second phase
China’s FTAs Under Negotiation
- Regional Comprehensive Economic Partnership (RCEP)
- China-GCC (Gulf Cooperation Council) FTA
- China- Japan-Korea FTA
- China-Sir Lanka FTA
- China-Israel FTA
- China-Norway FTA
- China-New Zealand Upgrade FTA
- China-Moldova FTA
- China-Panama FTA
- China-Korea FTA second phrase
- China-Palestine FTA
- China-Peru FTA Upgrade
- China-Cambodia FTA
China’s FTAs Under Consideration
- China-Columbia FTA Joint Feasibility Study
- China-Fiji FTA Joint Feasibility Study
- China-NePal FTA Joint Feasibility Study
- China-Papua New Guinea FTA Joint Feasibility Study
- China-Canada FTA Joint Feasibility Study
- China-Bangladesh FTA Joint Feasibility Study
- China-Mongolia FTA Joint Feasibility Study
- China-Switzerland FTA Upgrade Joint Feasibility Study
Preferential Trade Agreement
- Asia-Pacific Trade Agreement (APTA)
For details, please refer to China FTA Network.
Economic Relations with Hong Kong
- Hong Kong is the largest source of overseas direct investment in the Chinese Mainland. By the end of 2018, among all the overseas-funded projects approved in the Chinese Mainland, 46.3% were tied to Hong Kong interests. Cumulative utilised capital inflow from Hong Kong amounted to US$1,098.1 billion, accounting for 54.1% of the national total.
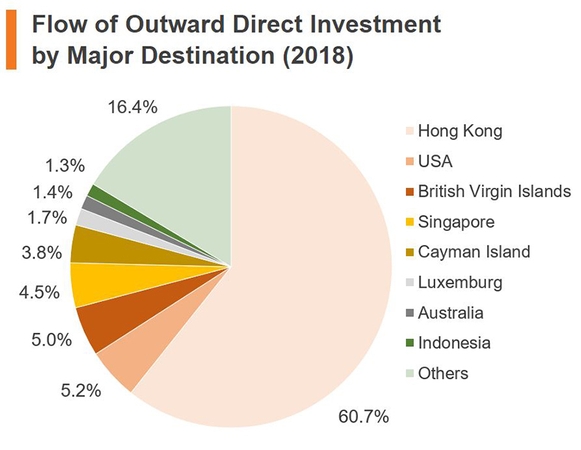
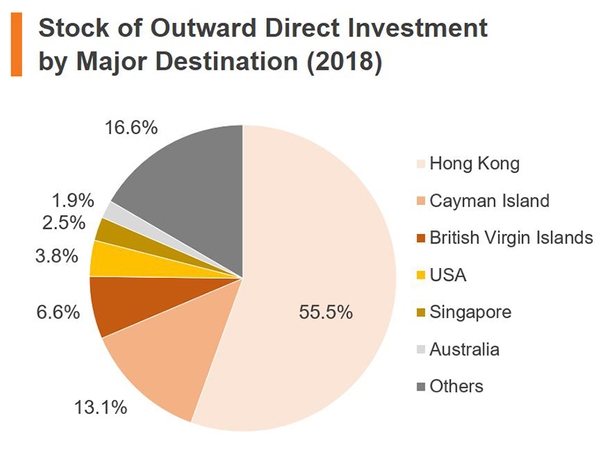
- Hong Kong is also the leading destination for China’s FDI outflow. According to Chinese statistics, by 2018, the stock of FDI going to Hong Kong accumulated to US$1,100.4billion, or 55.5% of the total outflow of FDI.
- Chinese Mainland is one of the leading sources of inward investment in Hong Kong. According to Hong Kong statistics, the stock of Hong Kong's inward investment from the Chinese mainland amounted to US$526.1 billion at market value or 26.8% of the total at the end of 2018.
- As of December 2019, 1,241 mainland companies were listed in Hong Kong, comprising H-share, red-chip and private companies with total market capitalisation of around US$3.58 trillion, or 73% of the market total.
Hong Kong's Direct Investment in the Chinese Mainland
Projects, contracted and utilised direct investment | 2018 | 1979-2018 | ||
No./ Value | Share of the national total (%) | No./ Value | Share of the national total (%) | |
Number of approved projects | 39,868 | 65.9 | 444,398 | 46.3 |
Utilised direct investment (US$ bn) | 89.9 | 66.6 | 1,098.1 | 54.1 |
Sources: China Monthly Economic Indicators | ||||
- Hong Kong was the Mainland's third largest trading partner (after the US and Japan) in 2019. According to China's Customs Statistics, bilateral trade between the Mainland and Hong Kong amounted to US$288.0 billion (6.3% of the Mainland's total external trade) in 2019. Of which exports from the Chinese Mainland to Hong Kong stood at US$278.9 billion, making Hong Kong the second largest export market, after the US.
- The Mainland has been Hong Kong's largest trading partner since 1985. Share of the Mainland in Hong Kong's global trade jumped from 9.3% in 1978 to 50.8% in 2019. The Chinese Mainland was Hong Kong’s largest import source accounting for 46.6% of Hong Kong’s total imports, and the largest export market accounting for 55.4% of Hong Kong’s total exports in 2019.
- Hong Kong's trade with the Chinese Mainland is to a large extent related to outward processing activities. In 2019, 25.3% of Hong Kong's total exports to the Chinese Mainland were related to outward processing activities. Meanwhile, 38.6% of Hong Kong’s imports from the Mainland and 68.7% of Hong Kong's re-exports of the Mainland origin to all countries were related to outward processing.
Hong Kong's Trade with the Chinese Mainland [1]
Unit | 2019 | Jan-May 2020 | ||||
Value | Growth | Ranking | Value | Growth | Ranking | |
| Total exports | 283,443 | -3.3 | 1 | 109,330 | 1.0 | 1 |
| Domestic exports | 2,649 | 0.9 | 1 | 959 | 0.5 | 1 |
| Re-exports | 280,794 | -3.4 | 1 | 108,371 | 1.0 | 1 |
| Imports | 263,858 | -5.9 | 1 | 89,069 | -15.1 | 1 |
| Total Trade | 547,301 | -4.6 | 1 | 198,398 | -6.9 | 1 |
| Trade Balance | 19,585 |
|
| 20,261 |
|
|
Sources: Census & Statistics Department of Hong Kong [1] Since offshore trade has not been captured by ordinary trade figures, these numbers do not necessarily reflect the total business managed by Hong Kong companies. | ||||||
Official tendering and bidding websites (All websites are only available in Simplified Chinese)